Dinamic MANOVA Biplot (DMB): A New Method for Multivariate Visualization Validated with Neutrosophic Plitogenic Statistics
Keywords:
Biplot MANOVA, dynamic visualization, multivariate analysis, neutrosophic plitogenic statistics, universities, SCImago IBERAbstract
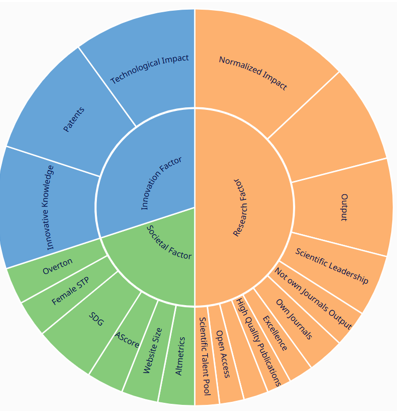
With the increase in complexity surrounding multivariate data, primarily found in institutional and social studies, there comes a need for inferential and visual tools that render statistically sound yet easy-to-interpret exploration. Although MANOVA tests a global comparison of means heterogeneity between groups, it is not a geometrically representable action to be interpreted, while biplot methods almost exclusively render static results. Here we propose the Dynamic MANOVA Biplot (DMB), an extension of MANOVA via canonical discriminant analysis, which renders geometric representation in fixed canonical space over time of multivariate mean separation between groups and groups trajectories over time. The novel aspect of this procedure is the possibility of unifying three ways of analyzing the problem: (i) multivariate separation between means groups of MANOVA, (ii) graphical representation of variables and centroids in a canonical reduced plane, and (iii) dynamics that signal how each group travels through the same geometric space across differently timed manifestations. The original geometric interpretation of MANOVA is preserved and, moreover, given a dynamic interpretation for longitudinal assessments without the need to recalculate the canonical space. Projection is achieved under the theoretical use of supplementary points in a discriminant context which enables means matrices to be added without configuration of the initial canonical layout. Thus, Mahalanobis's metric is preserved and comparability is maintained in third-way or third-way conditions. The practical relevance of Dynamic MANOVA Biplot, therefore, is both singularly theoretically based yet solidified by an applicable, easy-to-understand and visually coherent renderings for complex systems whose structure change over time. This is of particular benefit to institutional performance, education, health, and socioeconomic considerations. Thus, Dynamic MANOVA Biplot transforms an effort exclusively linked to the MANOVA biplot statistics from a merely analytical tool into an exploratory device that renders how mean associations between groups differ - whether they come together or separate - from one point to another over time. Thus, it extends a multisided approach to inference via visualization made clear through multivariate studies similar to those found in dimensional temporal data. Thus, this new method expands the multivariate analysis literature surrounding MANOVA biplots where inference meets visuals within the dimensional studies field. Final assessment is facilitated by Neutrosophic Plitogenic Statistics rendering each SCImago indicator a plitogenic number <value, dominance, contradiction> with an overall aggregation of 0.98 confirming strengthening around the NMB at 100% from Neutrosophic Statistics. We applied this advanced method to the SCImago IBER ranking (2019-2025) index multivariate analysis of universities included in it.
Downloads
Downloads
Published
License
Copyright (c) 2025 Neutrosophic Sets and Systems

This work is licensed under a Creative Commons Attribution 4.0 International License.


